

Turbo-Satori
Turbo-Satori is a real-time analysis program for functional near-infrared spectroscopy (fNIRS) data (at present only for hardware from NIRx company). While the also available Satori program is aimed at offline analysis, Turbo-Satori is optimised for real-time applications such as neurofeedback and brain computer interface (BCI) applications. The software supports online oxy/deoxy concentration value calculations from raw wavelength data and it provides advanced in-built neurofeedback options. Some of its main features are:
- The program calculates and shows oxy and deoxygenated haemoglobin concentration values. These values will be used for time course displays and neurofeedback as default except in case that the “Show raw WL data” option is set explicitly. The deoxy (or wavelength 2) data is shown with thinner drawing pens in the selected channel plotter but with the same colour as the corresponding oxy signal. For a good channel, the oxy signal should move upward during activation while the deoxy channel should move downward; the deoxy signal (negative) amplitude should also be about 0.1-0.2 the amplitude of the oxy signal.
- Since the oxy/deoxy concentration values need a baseline of raw data before it can be calculated in real-time for future time points, the program initially shows raw data and switches to oxy/deoxy data display as soon as the baseline is available. As default, the baseline is calculated from the first 200 received values but this can be changed using the “Hb/HbO baseline calculation period, Begin:” and “End” fields in the “Real-Time Analysis Setup” dialog.
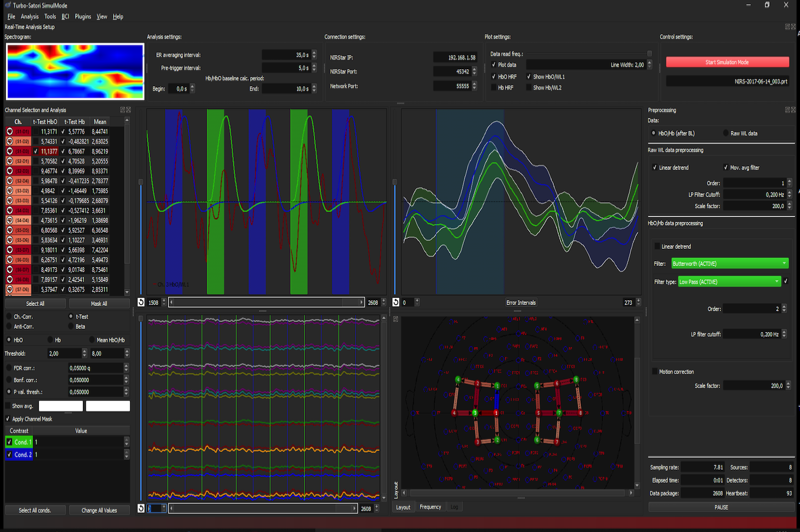
- Raw wavelength and converted oxy/deoxy data has its own preprocessing sub-panel. The values of the full channel plotter and especially of the selected (and event-related) channel plotter need to be scaled so that they fall within -1 and +1 (the range of the y axis). Preprocessng options allow to detrend the raw data and both raw and oxy/deoxy data can (should be) low-pass filtered.
- The low-pass filter can now be given in Hz and this is internally converted to the appropriate moving average filter length. The default of 0.7 Hz should be fine but you can increase/decrease it a bit to get smoother results eventually. You should NOT make the filter very strong (e.g. 0.1 Hz) since the stronger the filter the more the real-time signal will be delayed. With the default of 0.7 Hz the delay is only about half a second while achieving a pretty good removal of the heart-beat fluctuations that are strongly visible when turning off the low-pass filter or when setting it higher than 1 Hz.
- The raw and oxy/deoxy data have their own scaling factors that should be adjusted so that the data falls in a value range of -1 to 1. The adjusted values will be stored to disk (global settings) so that they will be re-used as default automatically in subsequent experiments.
- Multiple channels can now be selected to be used for neurofeedback. While the selected channel plotter shows all selected channels separately (overplotted), the oxy and deoxy signals of the selected channels will be averaged for neurofeedback. The Neurofeedback dialog now allows to select either the (averaged) oxy or (averaged) deoxy data of the selected channels or a combined value from oxy and deoxy data (see below).
- The channel selection pane on the left side has now been extended to allow easy selection of multiple channels that will be shown in the time course window and used for neurofeedback. The selected channels show the color used in the plot windows so that they can be more easily identified. Besides the “Selected” column an additional “Mask” column is now shown that can be used to block display of noise channels. Simply turn on a channel, check whether the data is noisy and if so, turn the channel off by deselecting it in the “Mask” column. This should be done with the data in a lcoalizer run and the same settings can then be established at the begin of a neurofeedback run. Note that masking does not have any effect on processing, it only hides “bad” channels and reduces display load, which can help in case the software does not manage the real-time requirement.
- A protocol with a baseline and one (or more) neurofeedback conditions needs to be defined, preferably using “Seconds” protocol (see provided example below).
- The neurofeedback dialog should be opened after data streaming has been started and a protocol is available (for now) using the “BCI -> Neurofeedback” menu item.
- Values for neurofeedback are calculated by subtracting the last baseline (BL) from the current scaled oxy/deoxy value. Note that deoxy values are inverted so that a negative deflection results in a positive feedback signal.
- The resulting values are scaled to a level of the thermometer for display in relation to the “Max Val Oxy” and “Deoxy” values that can be changed in the Neurofeedback dialog.
- As default, oxy and deoxy neurofeedback values are stored in text files - one for each time point - in a sub-folder called “NeurofeedbackValues” which will be placed within the folder containing the specified protocol (.prt) file. Each text file is named “Feedback-
.txt” and contains 7 values: the pre-condition oxy-baseline value, the oxy feedback value, the calculated oxy level (integer) specifying the filling of the thermometer, the pre-condition deoxy baseline value, the deoxy feedback value, the calculated deoxy thermometer level and a value specifying the current condition as an index value. If export of numerical values is not needed, turn off the “Export numerical values to disk” option in the “Neurofeedback” dialog. - Also the feedback images (thermometer) can be saved - one for each time point. Also the image files are located in a sub-folder (“NeurofeedbackImages”) of the folder where the protocol was selected from. Saving of images is NOT activated as default - to use this option, you need to turn on the “Export image snapshots to disk”. The images will be saved as PNG files with the naming pattern “Feedback-
.png”. - The duration of the instruction display can now be specified in seconds, i.e. it does not appear after only one frame as in v0.2.
- Feedback is now always shown in all conditions (including baseline) as default. Turn on the “No Feedback Condition” option in the “Feedback baseline data points” field in the Neurofeedback dialog if you do not want to show neurofeedback to the subject during baseline (usually preferred).
- The entered IP address, port, timeout values are stored in global settings so that they have not to be reentered manually again when restarting the program.
- It is advised to close the program after analysing one run and re-open it instead of using it for multiple runs since some internal memory settings might not be properly adjusted.
- Note that you can close the “Real-Time Analysis Setup” dialog after starting data streaming from the NIRx host (or after selecting a .sri project file in simulation mode).